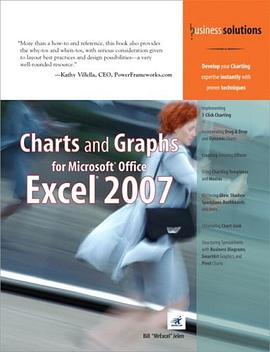

<>It is easy to create a bad looking chart in Excel. This book teaches you how to unlock the beautiful formatting options available to make incredible looking charts. The first section will talk about how to decide which chart type to use. Subsequent chapters will walk through each chart type, how to create them, how to utilize them, and special options available for each chart. The book discusses themes, colors, creating metallic charts, shadows, transparency, etc. The book also handles anything graphical in Excel. It will show the new In-Cell Data Bar charts available in Excel 2007. A section will talk about creating business flowcharts with IGX Graphics and how to display product pictures in Excel, and a section on VBA will cover creating 100's of charts using the macro language.
</p> <p style="margin: 0px;"> </p> <p style="margin: 0px;">“More than a how-to and reference, this book also provides the why-tos and when-tos, with serious consideration given to layout best practices and design possibilities–a very well-rounded resource.”</p> <p style="margin: 0px;">–Kathy Villella, CEO, PowerFrameworks.com</p>
<div style="margin: 0px;">Implementing 1-Click Charting
<div style="margin: 0px;">Incorporating Drag & Drop and Dynamic Charts
<div style="margin: 0px;">Creating Amazing Effects
<div style="margin: 0px;">Using Charting Templates and Macros
<div style="margin: 0px;">Mastering Glow, Shadow, Sparklines, Dashboards, and More
<div style="margin: 0px;">Eliminating Chart Junk
<div style="margin: 0px;">Structuring Spreadsheets with Business Diagrams, SmartArt Graphics, and Pivot Charts
<div style="margin: 0px;">Develop your Charting expertise instantly with proven techniques <p style="margin: 0px;">After 15 years with no updates to the Excel charting engine, Microsoft has provided a complete rewrite of the chart rendering engine in Excel 2007. However, no amount of soft glow or glass bevel effects will help you communicate your point if you use the wrong chart type. This book helps you choose the right charting type and shows you how to make it look great.</p> <p style="margin: 0px;"> </p> <p style="margin: 0px;">This book shows you how to coax Excel to create many charts you might not have believed were possible. You’ll learn techniques that allow you to ditch the Microsoft defaults and actually create charts that communicate your point. You’ll learn why the Excel stock charts are so restrictive and how you can easily turn any line chart into a stock chart–without any limitations. You’ll also learn how to add invisible series to make columns float in midair. Learn how to create charts right in Excel cells using the new Excel 2007 data bars–or even the decades-old REPT function!</p> <p style="margin: 0px;"> </p> <p style="margin: 0px;">In no time, this book will have you creating charts that wow your audience and effectively communicate your message.</p>
<div style="margin: 0px;">Master effective visual display of data
<div style="margin: 0px;">Choose the right chart type to convey your message
<div style="margin: 0px;">Learn time-saving workarounds
<div style="margin: 0px;">Create charts that most people think you can’t create with Excel
<div style="margin: 0px;">Understand what a Radar chart is and when you might use it
<div style="margin: 0px;">Summarize a million rows of data in a single pivot table chart
<div style="margin: 0px;">Present data graphically without charts
<div style="margin: 0px;">Employ SmartArt graphics to show process or relationship charts
<div style="margin: 0px;">Utilize VBA to create charts
<div style="margin: 0px;">Put your data on a map
<div style="margin: 0px;">Export your charts to the web or PowerPoint
<div style="margin: 0px;">Detect chart lies<p style="margin: 0px;">ABOUT THE AUTHOR</p> <p style="margin: 0px;">Bill Jelen is MrExcel! He is principal behind the leading Excel website, MrExcel.com. He honed his Excel wizardry during his 12-year tenure as a financial analyst for a fastgrowing public computer firm. Armed with only a spreadsheet, he learned how to turn thousands of rows of transactional data into meaningful summaries in record time. He is an accomplished author of books on Excel and is a regular guest on The Lab on TechTV Canada. You can find Bill at your local accounting group chapter meeting entertaining audiences with his humorous and informative Power Excel seminar. His website hosts more than 12 million page views annually.</p> <p style="margin: 0px;"> </p><p style="margin: 0px;">
</p> <p style="margin: 0px;"></p> <p style="margin: 0px;">Introduction
</p> <p style="margin: 0px;">1 Introducing Charts in Excel 2007
</p> <p style="margin: 0px;">2 Customizing Charts
</p> <p style="margin: 0px;">3 Creating Charts That Show Trends
</p> <p style="margin: 0px;">4 Creating Charts That Show Differences
</p> <p style="margin: 0px;">5 Creating Charts That Show Relationships
</p> <p style="margin: 0px;">6 Creating Stock Analysis Charts
</p> <p style="margin: 0px;">7 Advanced Chart Techniques
</p> <p style="margin: 0px;">8 Creating and Using Pivot Charts
</p> <p style="margin: 0px;">9 Presenting Data Visually Without Charts
</p> <p style="margin: 0px;">10 Presenting Your Excel Data on a Map Using Microsoft MapPoint
</p> <p style="margin: 0px;">11 Using SmartArt Graphics and Shapes
</p> <p style="margin: 0px;">12 Exporting Your Charts for Use Outside of Excel
</p> <p style="margin: 0px;">13 Using Excel VBA to Create Charts</p> <p style="margin: 0px;">14 Knowing When Someone Is Lying to You with a Chart
</p> <p style="margin: 0px;">Appendix A: Charting References
</p> <p style="margin: 0px;">Index</p> <p style="margin: 0px;"></p>
具體描述
讀後感
評分
評分
評分
評分
用戶評價
相關圖書


本站所有內容均為互聯網搜索引擎提供的公開搜索信息,本站不存儲任何數據與內容,任何內容與數據均與本站無關,如有需要請聯繫相關搜索引擎包括但不限於百度,google,bing,sogou 等
© 2025 qciss.net All Rights Reserved. 小哈圖書下載中心 版权所有